Searching Premium Content
Your Premium Content Summary is a page ARInsights sets up for you, giving a bird’s eye view of analyst coverage of your company – as well as of the terms/keywords and competitors you’d like to track – over a specified period of time. You can run searches directly from that page or use the Premium Content search page.
In the search bar, you can search by company name, keyword or hashtag, using Boolean logic (“or,” “and,” and “not”) to include or exclude certain phrases. You can also set a date range for results and add filters (e.g., only looking at coverage among certain analyst groups). In addition, you can specify the channels – analyst reports, blogs, quotes in the media, and/or Tweets – that you want included in results.
For example, the screenshot below shows a sample list of analyst coverage of a given company on mobile payment, over the past month, in research reports, blogs, tweets, and media articles.
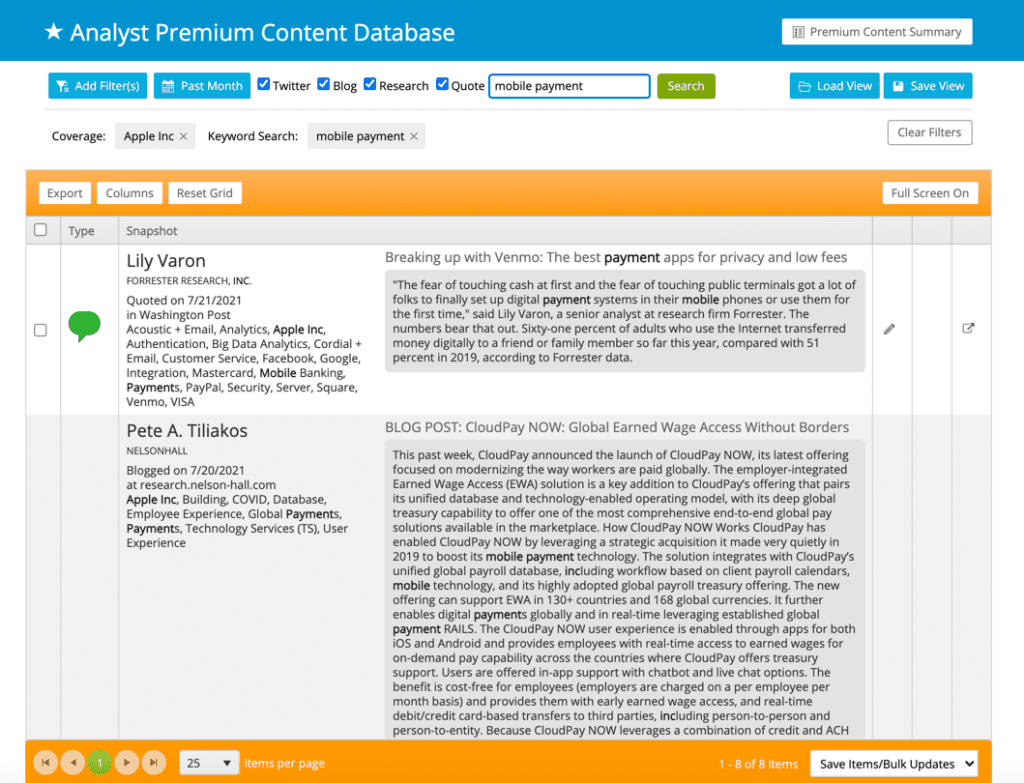
Once you have the information you need, you’ll want to save the results to your ARchitect library (“articles” section), so you can use them to run reports. While saving is done in a matter of clicks, we can automate this process for you too, which comes in handy when there are certain topics or companies you want to track and report on at definite intervals (monthly, quarterly, etc.).
Reporting on Analyst Mentions
You can use the data from Premium Content to power a variety of reports – satisfying executives’ appetites for metrics, and helping you see where AR is succeeding and where more effort may be needed.
As we showed in the Learning Series, you can create Article Summary Reports that visually display and synthesize your Premium Content data. The one below, for example, is set to show a company’s research inclusions from the past month — broken out by firm.
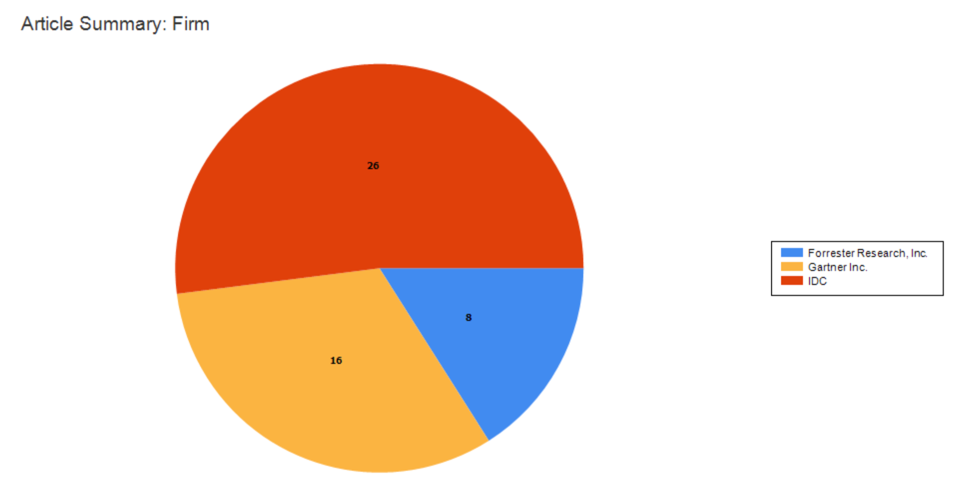
ARchitect also provides additional tables below this graph — enabling you to view trends and results over time (such as month-to-month or quarter-to-quarter) and dig into the details of the specific reports that make up the coverage results.
Generating Share of Voice Reports
Many AR teams and businesses measure and report on “share of voice” (SOV) on a consistent basis, to track how well they’re moving the needle with key analysts, and how frequently they’re being covered compared to competitors. Share of voice reports look at total analyst coverage across mediums over a given period of time — showing how the coverage in a given market is split between your company and its competitors. Measuring this manually is an onerous — if not impossible — task, so take advantage of technology!
Pulling in data from Premium Content, ARInsights automates the process, enabling you to create SOV reports in just a few clicks. You’ll designate the keyword(s) you want to search for (terms that encapsulate your market), competitors you want to include and which source(s) should be factored into the results (selecting from analyst research, blogs, quotes in the media and Tweets). You can apply additional filters, as many of our customers do — for example, looking at how coverage of your keyword(s) is split among your company and competitors, pulling in data from only your top-tier, pre-defined analysts.
SOV reports can be powerful reports to share with executives, and can help you identify areas of AR success in your business, along with areas where more focus may be needed. By tracking SOV over time, you can also see how major launches or events impacted your share of coverage during a given period.
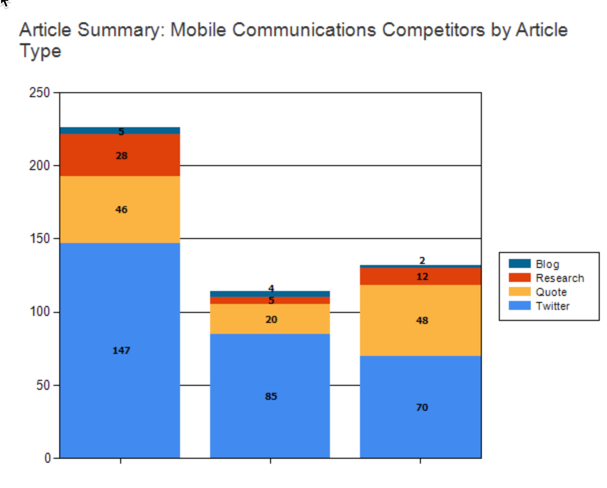
Here’s a sample SOV report output, below, with company names blurred out — looking at mobile communications competitors and breaking out coverage by article type. Additional tables in ARchitect provide a further breakdown and let you see the individual inclusions that make up the report.
Interested in seeing a real-world, SOV use case? We recently published a case study with global cybersecurity leader Palo Alto Networks — showing how the company consistently tracks AR results across its various business units using ARchitect SOV reporting.
If you’d like more information about any of the topics covered in the Learning Series, please reach out to us at support@arinsights.com. We’re happy to help.