Published August 2025
If you’re in analyst relations, you know this scenario: You’ve just wrapped a crucial analyst briefing, feeling good about the conversation—and then reality hits. Hours of follow-up work await: extracting insights, updating stakeholders, tracking sentiment changes, and making sure nothing important gets lost in the shuffle.
We’ve heard this story from hundreds of AR professionals over the past year. That’s why we spent the first half of 2025 shipping features focused on one goal: helping you spend less time on administrative tasks while making it easier to demonstrate how your AR work drives real business results.
Why These Updates Matter for Your AR Program
Before we dive into what’s new, let’s talk about why we built these specific capabilities. Through conversations with our customers—from solo AR managers at mid-size companies to directors leading large enterprise teams—we identified three key challenges holding AR programs back:
- Too much manual work stealing time from relationship building
- Scattered data making it hard to see the complete influence picture
- Difficulty connecting AR activities to business outcomes
Our H1 2025 roadmap tackled each of these head-on (and spoiler alert, so will H2).
Skip the Post-Meeting Administrative Marathon
New capabilities that capture insights automatically—so you can focus on what analysts are actually saying
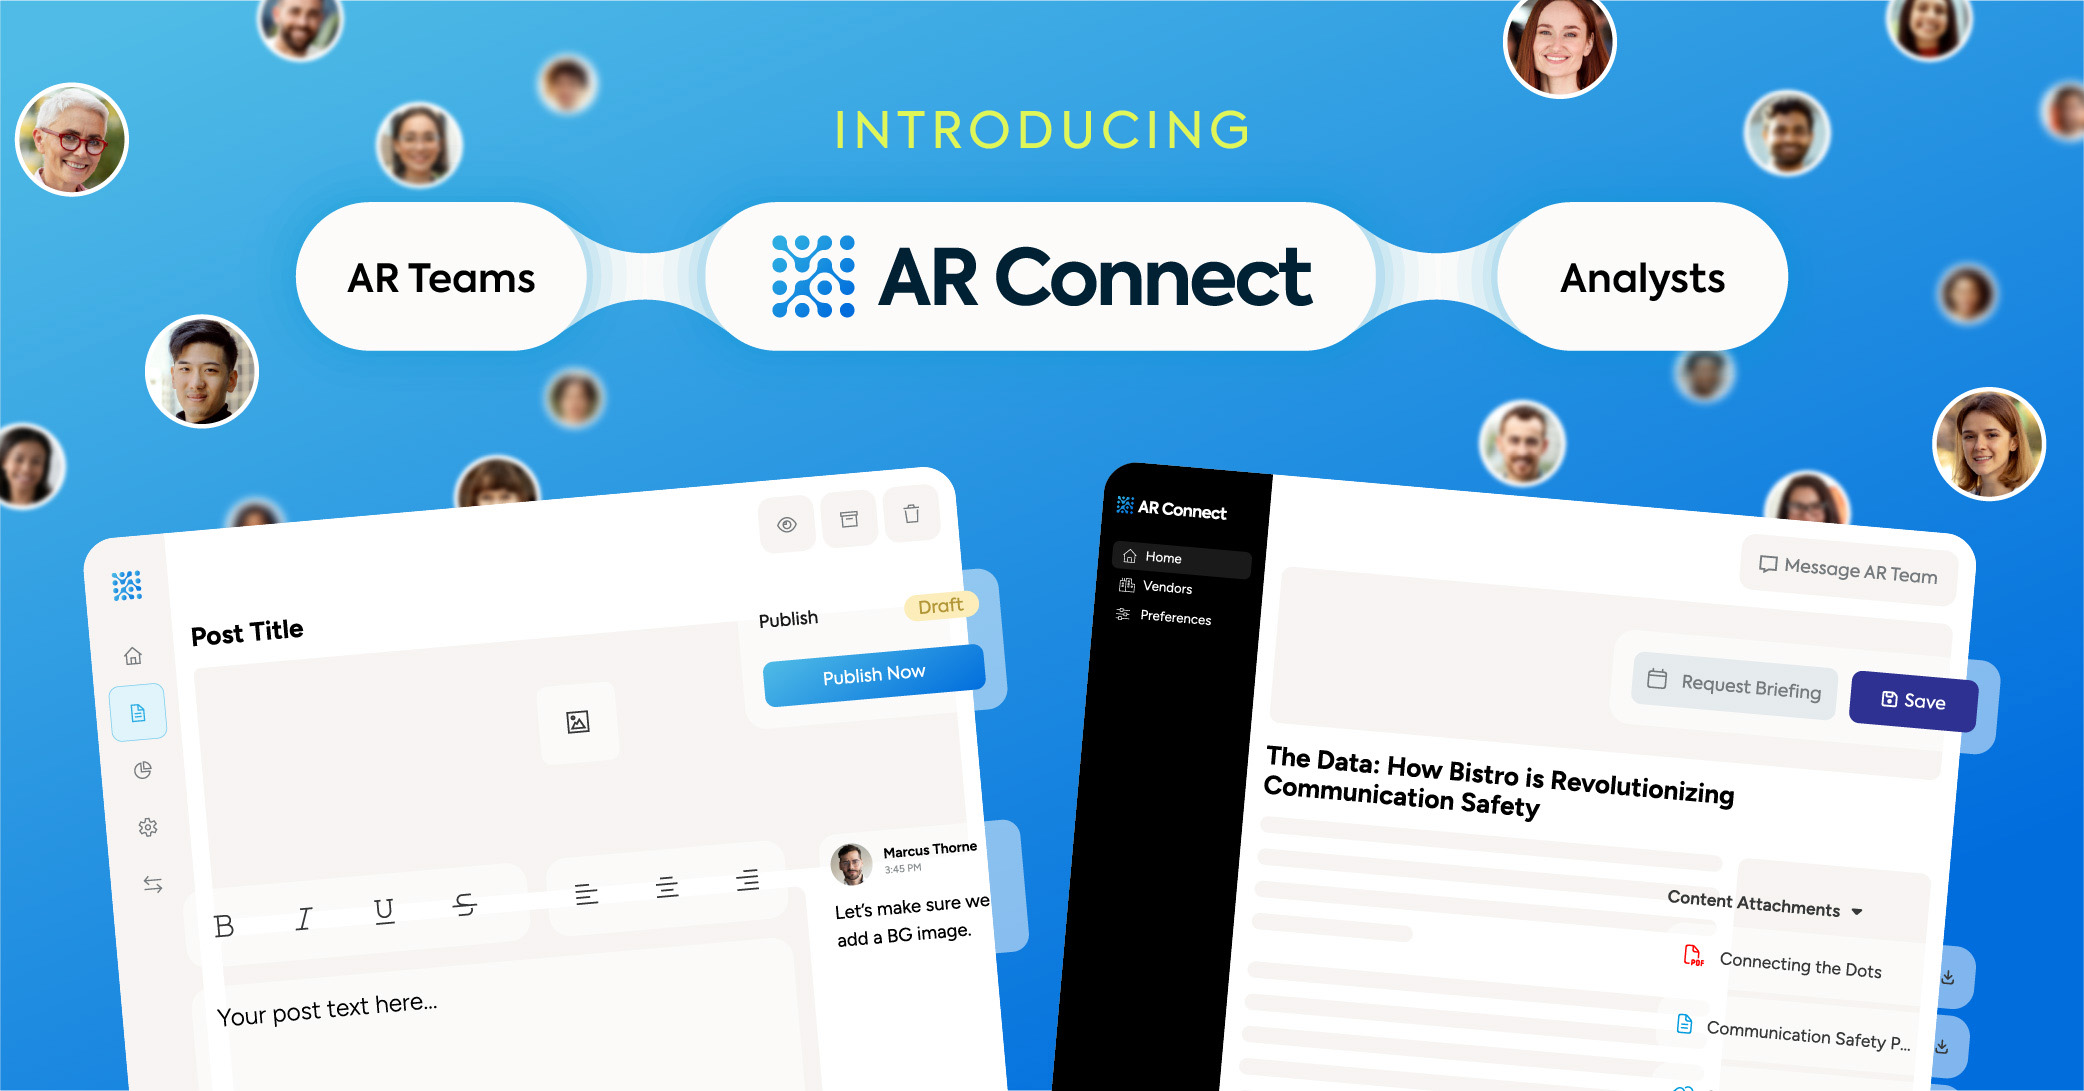
Smart Interactions & Insights Engine
What it does: Upload any document (meeting notes, transcripts, spreadsheets, emails) and ARchitect automatically extracts key details, creates summaries, and suggests insights you can share with stakeholders.
Why it matters: No more spending 30 minutes after every analyst call typing up notes. The AI does the heavy lifting so you get to focus on strategy.
Pro tip: Use custom prompts to format summaries for specific audiences—executives need different details than product managers.
Choose Your AI Model
What it does: Pick from IBM Granite, Anthropic Claude, or OpenAI ChatGPT for your interaction summaries and insight generation.
Why it matters: Different AI models have different strengths and different organizations have different security requirements for AI usage. Now you can choose the model that works best for your content and use cases while adhering to your company’s AI governance policies.
Organize Data the Way You Actually Work
Because generic categories don’t tell your company’s unique story
Custom Insight Categories
What it does: Create your own insight categories that match how your team talks about and leverages AR content.
Why it matters: Spend less time translating for your stakeholders and more time reporting on the impact AR is having on the business.
Bulk Insights updates
What it does: You can now update insight categories and assigned coverages in bulk.
Time saved: What used to take 20 clicks now takes 2.
Modernized Influencer Groups
What it does: Completely rebuilt workflow for creating and managing influencer groups with bulk import and better filtering.
Use case: Quickly segment analysts by research focus, geography, or influence level for targeted campaigns.
Find the right analysts faster
Because chasing the wrong analysts wastes everyone’s time
Standard views for Power 100 Lists
What it does: Four pre-built views in your Influencer Finder that leverage our new Power 100 analyst rankings.
The shortcut: Jump straight into finding the analysts who matter most for your goals instead of building filters from scratch.
Enhanced Gartner Peer Insights filtering
What it does: New Product and Review Category filters help you find all relevant GPI reviews without missing anything important.
Why this matters: Customer reviews on Gartner Peer Insights can make or break your positioning. Now you won’t miss the ones that matter and you can proactively engage with analysts to address any concerning patterns or narratives before they solidify.
Reports that actually tell your story
Data visualization that helps stakeholders understand AR’s business impact
Next-Gen Reporting
What it does: Beautiful, fast-loading charts for all our Interactions, Projects, and Insights reports. Download as CSV/XLS, image or view data as tables.
The upgrade: No more waiting for clunky PowerBI reports to load during executive presentations.
Better data visualization
What it does: Bar charts organize in descending order with highest counts most prominent. Switch between bar and pie chart views.
Why this matters: Good data visualization accelerates decision-making. When patterns are immediately obvious, teams can spot opportunities, identify risks, and pivot strategies faster than competitors still wrestling with spreadsheets.
AI Summaries in reports
What it does: AI-generated summaries appear directly in Insights and Interaction reports for quick TL;DR of key details.
Executive-friendly: Perfect for busy stakeholders who need the highlights without diving into raw data.
Work seamlessly across your tools
Gmail & Outlook Plug-in Enhancements
What it does: Add-ins now support attachments when creating interactions.
Real workflow: Forward an analyst’s research report with your interaction notes—everything stays connected and searchable.
Improved Email Reliability
What it does: Retry mechanisms for emails that fail to send.
Peace of mind: Your communications reach analysts when they should, every time.
The real impact: What customers are saying
These aren’t just productivity improvements—they’re designed to help our customers demonstrate AR’s strategic value. Here’s how customers are using these capabilities:
“The Smart Insights Engine helped us spot a pattern across 15 analyst interactions—they all had the same concern about our API security. We addressed it in our next product release and saw sentiment improve across three major reports.”
“Custom insight categories let us track competitive mentions separately from product feedback. When our CEO asked how we’re positioned against our biggest rival, I had the data ready in 30 seconds.”
What’s next?
We’re not stopping here. These updates lay the foundation for even smarter AR intelligence—capabilities that will help you predict analyst sentiment changes, identify the highest-impact relationship opportunities, and quantify AR’s contribution to pipeline and revenue.
Ready to see these features in action? Schedule a demo with our team or reach out to Customer Experience for a personalized walkthrough.
Current ARchitect customer? Check out our Knowledge Base for step-by-step guides on each new feature.
Have ideas for what we should build next? We’d love to hear from you—your feedback drives our roadmap. Drop us a line at product@arinsights.com.