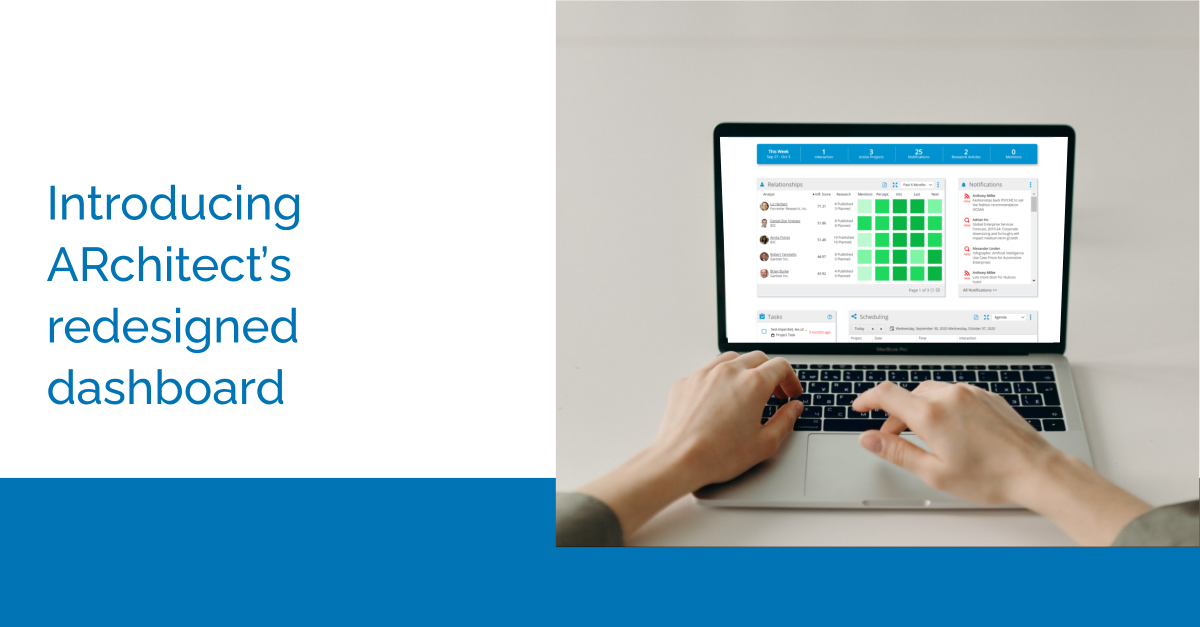
The dashboard was recreated to solve your problems of planning and executing an AR plan by implementing many tools in one place: the relationship heat map, notifications, scheduling, and tasks.
The Relationship Heat Map
Let’s start off with a feature that focuses entirely on your strategic relationships. With the Relationship Heat Map, you can see how analysts are performing in the greater ecosystem by way of the Influencer Score and research counts. You can also measure out the health of your relationships in terms of colors by looking at your specific Interactions, Mentions, and Perception with your analysts.
There are 5 colors coding the health of your relationships that are evaluated based on the frequency of interactions with the analyst. The levels are set like this:
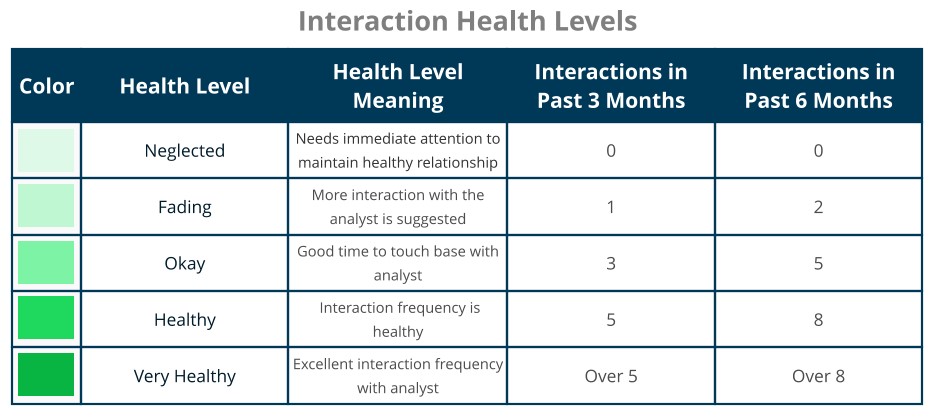
This means that you can easily see which of your analysts are thriving within your program and which ones need a bit more attention from your team. Because you can easily visualize what needs improvement, you will be able to make quick decisions on what moves are needed next. Guess what? If you need to take an action based on this information, like log an interaction or get the analysts email, you can do so in just one click.
Notifications
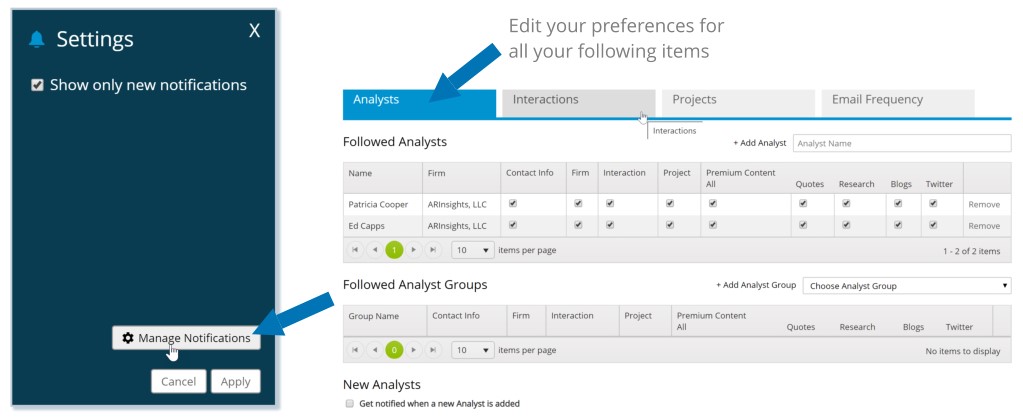
Notifications are a feature you have heard us talk about before and we’ve now brought it onto the redesigned dashboard. You can receive notifications on updates to analysts, interactions, and projects. This allows easy visibility into what’s changing around you, so nothing falls under the radar.
If you have already been using notifications, you may have noticed that we updated how you are “following” these items. To prepare for the dashboard release, we had you “auto-follow” all of the items you were associated with. Don’t want to follow them all? No problem. Click on notifications at the top of your screen or manage notifications on the dashboard widget to edit when and what you receive.
Scheduling
Scheduling has been a popular request and now you can stay organized by checking your project timelines, interaction calendars, and firm research agendas on the calendar view. The calendar view has a few different view choices depending on your purpose. Switch between a monthly birds eye view to the standard weekly or daily view and visually see the growth with color coded events. 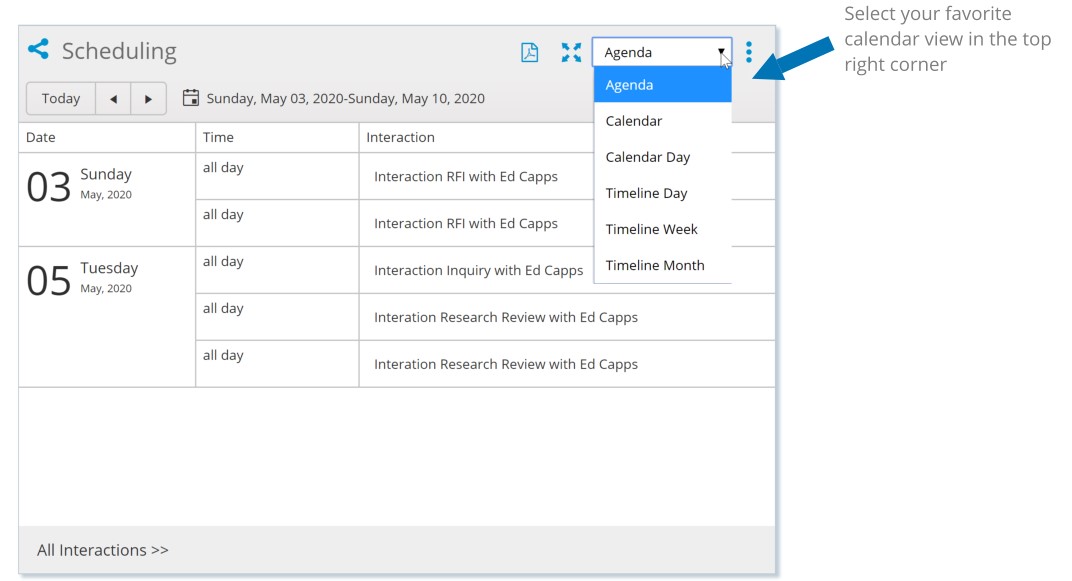
What’s the point? Visualize the big picture with your calendar and strategize what time needs to go where. Stay on top of all your future tasks when they are laid out in front of you and keep your days organized.
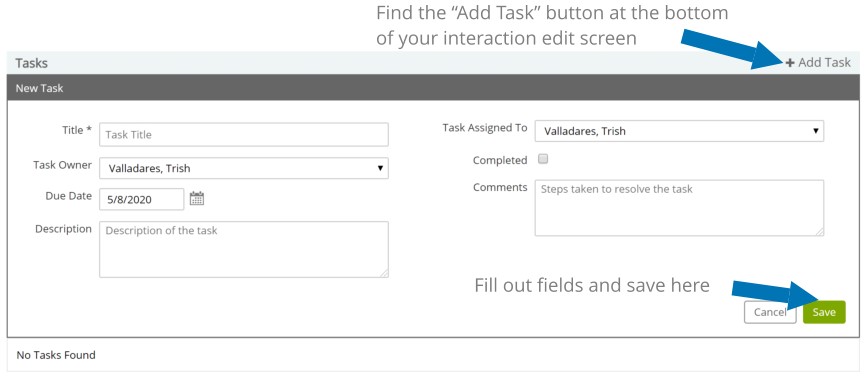
Tasks
If you have been using Follow Ups, you may have noticed that we replaced them with Tasks. Tasks that can now be seen on your Dashboard. You can also check these tasks off your To Do list on the Dashboard to move them from incomplete to complete.
Create a new task by navigating to an interaction and scrolling to the task section at the bottom. Click Add Task, assign the task to a teammate, and enter a due date. It’s really that simple.